Cities with the best public transportation in the world
Getting around a city efficiently can make or break your travel experience. Whether you're chasing free walking tours, jumping between must-see attractions, or just looking for the cheapest way to the airport, public transportation is often your best ally. But not all systems are created equal. Some cities make it easy, fast, and cheap to explore, while others can leave you lost, late, or over budget.
In this guide, we break down how public transport systems compare across major global cities and try to find cities with the best public transportation. From single-ticket prices to network reach and punctuality, you’ll find the insights you need to travel smarter, safer, and more affordably.
How do countries compare in terms of overall public transport performance, and which national systems stand out in terms of accessibility, infrastructure, and affordability?
To assess the overall development of public transport systems across countries, we developed the Public Transport Country Index, a composite score based on six key indicators, including ridership, service volume, stop density, fleet size, accessibility, and ticket cost.
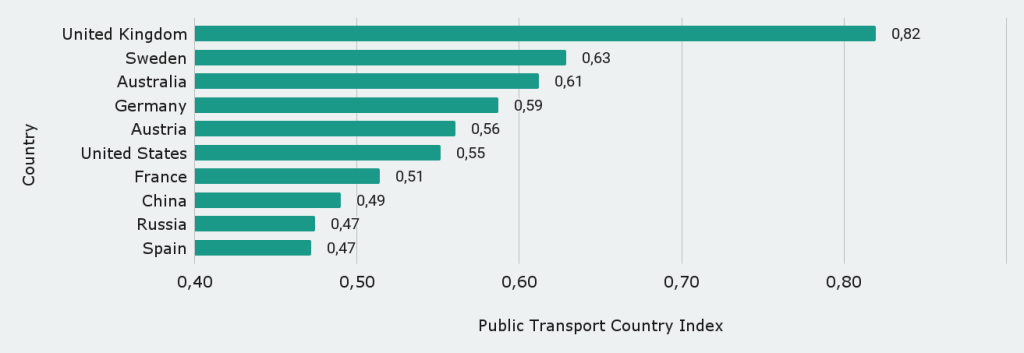
Looking at the bigger picture, the United Kingdom stands out for having one of the most reliable and extensive public transport systems that every budget-conscious traveler can appreciate. Thanks to long-term investments and well-connected networks, getting around cities like London is efficient (even if not always cheap).
Countries like Sweden, Australia, and Germany also offer high-quality systems that combine good accessibility, regular service, and a generally smooth experience, perfect for travelers who want to explore without renting a car or worrying about navigation.
On the flip side, while places like China and Russia have massive transit networks, their quality can vary a lot by region. This means travelers should do some extra research before relying entirely on public transport in those countries.
Let’s explore how cities around the world perform across key dimensions of public transport systems, including accessibility, infrastructure density, and affordability.
By comparing urban transit indices, number of stops, rail coverage, and ticket prices, we can identify which cities offer the most effective and inclusive mobility for residents and deserve to be called cities with the best public transportation.
From London’s high-performing but expensive network to Oslo’s unmatched infrastructure scale, the data highlight diverse models of public transport success and where key challenges remain.
Identifying the global leaders in urban public transport can offer benchmarks for other cities striving to enhance the quality and efficiency of their transit systems.
To better reflect the quality of urban transit services, we introduced the Public Transport City Index, which integrates nine indicators such as network scale, usage levels, accessibility, punctuality, and availability of digital features like apps and Wi-Fi.
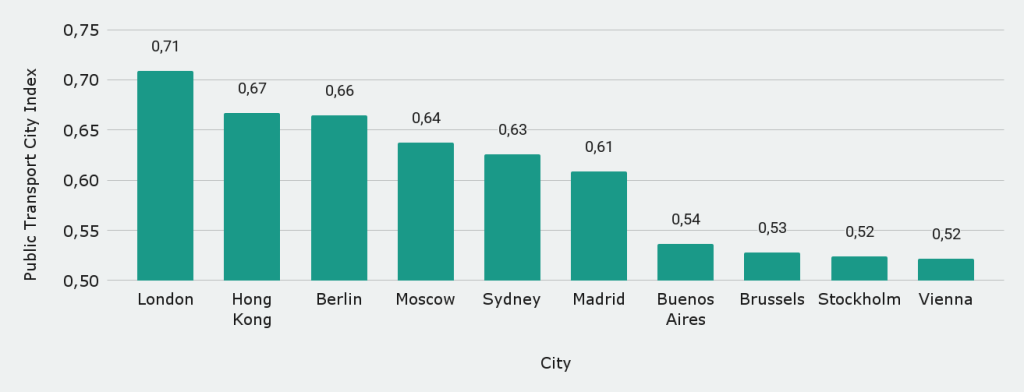
What do London, Hong Kong, and Berlin have in common? For travelers, they offer some of the world’s smoothest, most connected transport systems, making it easy to hop between neighborhoods, landmarks, or even airports without stress. These global hubs are a dream for those who want to see a lot in a short time, using just one transport card or app. These cities are really cities with the best public transportation.
But top-quality public transport isn’t just found in the world’s richest cities. Places like Buenos Aires and Moscow show that you can get excellent, affordable transit even in budget-friendly destinations. And cities like Vienna or Brussels, though less flashy, are proof that steady investment pays off in reliability and comfort for visitors and locals alike.
While some cities have the best public transportation, others face critical challenges in delivering accessible and effective public transportation. What do the lowest-ranked cities reveal about these shortcomings?
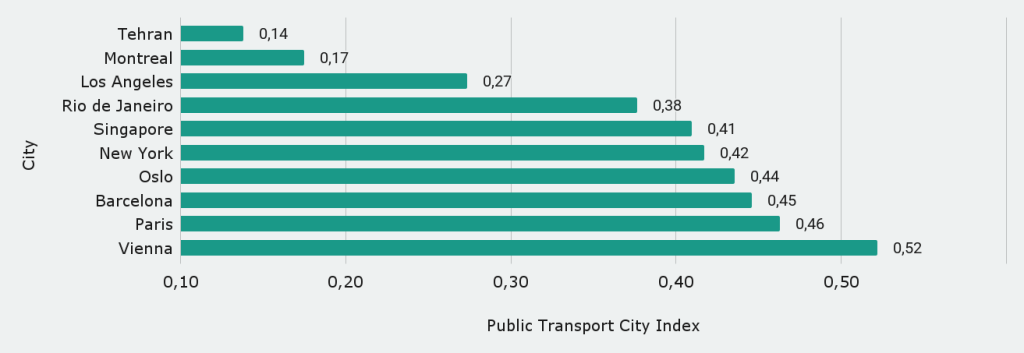
It’s easy to assume that rich cities always have great transport, but that’s not always the case. Even cities with great public transportation, like New York, Los Angeles, and Montreal, can leave travelers stuck in traffic, waiting on platforms, or juggling confusing fare systems. So, don’t let a city’s fame (or GDP) fool you.
On the other hand, places like Tehran and Rio de Janeiro reveal how deeper infrastructure or funding issues can impact your daily movement as a visitor, especially if you rely on public transport to explore.
And what about cities you’d expect to score near the top, like Paris, Singapore, or Oslo? While their systems are often modern and clean, travelers might still face surprises when it comes to pricing, accessibility, or transfers.
Beyond infrastructure size and investment, accessibility determines how effectively urban transport systems serve the daily needs of citizens.
To capture how accessible and user-friendly metro systems are for all users, including those with mobility challenges, we constructed the Rail Transit Accessibility Index, combining data on route numbers, step-free access, general accessibility, and service punctuality. By analyzing the Rail Transit Accessibility Index and comparing it with network reach and stop density, we highlight which urban environments provide the most convenient and equitable access to transport.
Accessibility is a key indicator of inclusivity for cities with great public transportation. Cities that perform well in this area ensure that mobility is not just available, but truly usable, for all segments of the population.
Rail systems are central to many cities’ mobility strategies. So, which urban areas provide the most accessible and connected rail infrastructure to their residents?
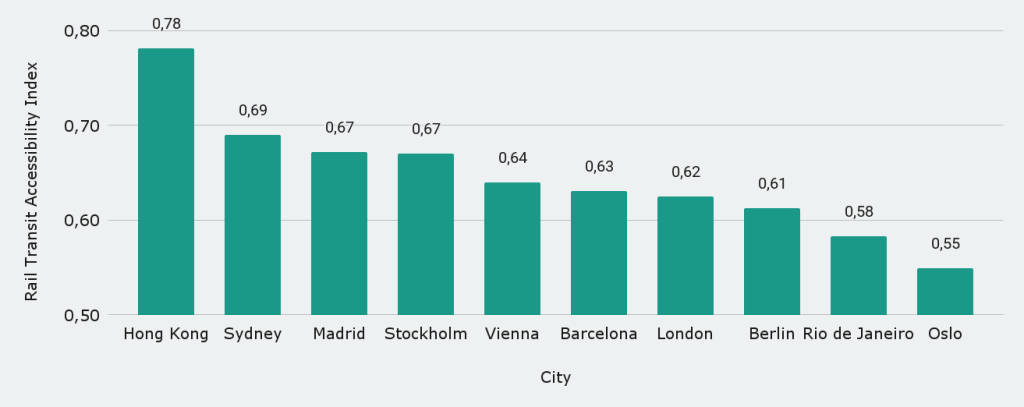
If you’re visiting a city like Hong Kong or Sydney, the good news is that getting around by train is surprisingly easy. Thanks to smart planning and modern infrastructure, you won’t need to rely on taxis or long walks to reach a station.
It’s not just the usual suspects either. Cities like Rio and Oslo show that top-notch rail accessibility isn’t limited to Europe or Asia’s megacities. For travelers, that means more places where you can hop on a train just minutes from your hostel, a free walking tour meeting point, or a favorite café.
Why does this matter? Because the easier it is to access the rail system, the more time and money you’ll save, and the less you’ll need to worry about navigating traffic or figuring out transfers. This is what you get when travelling to cities with great public transportation. Whether you’re squeezing in landmarks between walking tours or catching a sunset from the other side of town, strong rail access can make your day smoother, cheaper, and more relaxed.
A lack of rail transit accessibility may hinder mobility and sustainability. So, which cities are falling behind the cities with the best public transportation, and why?
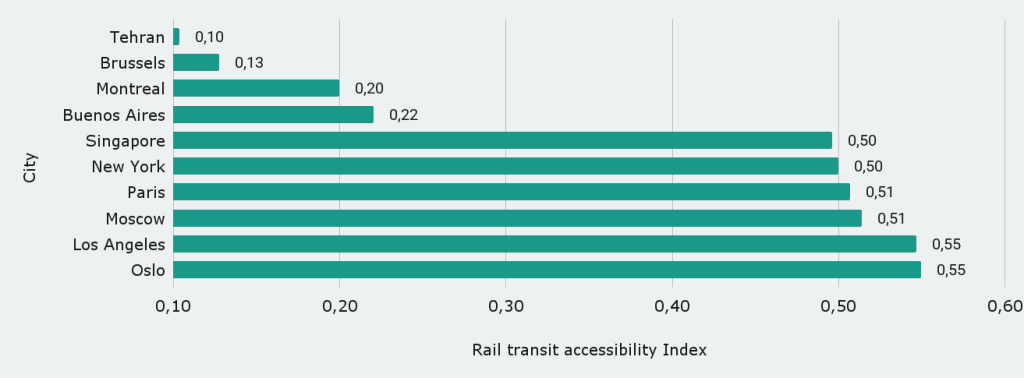
In cities like Tehran, Brussels, and Montreal, getting to a train might take longer than you’d expect, especially if you're staying outside the city center. Even in famous cities like Singapore and New York, you might find yourself walking further or relying on buses or taxis just to reach a rail station.
For travelers, that means planning is key. Low rail accessibility can eat into your time and budget, especially if you're trying to make the most of a short trip or jump between free walking tours across town.
But don't let that stop you. Most of these cities still offer solid transit once you're plugged into the network. Just keep in mind that choosing accommodation closer to a major rail or metro hub can save you both time and stress, and make your days more flexible and spontaneous.
While accessibility reflects how well public transport serves users, the scale and spread of physical infrastructure also shape everyday mobility.
Let's examine the physical density and coverage of public transportation networks by analyzing the number of stops per 100K inhabitants and the total length of public transport routes.
These indicators reveal how thoroughly a city’s transit system is woven into its urban fabric, affecting walkability, waiting times, and overall convenience for riders.
Cities with extensive and well-distributed networks tend to reduce reliance on private vehicles and promote sustainable mobility for the broader population.
The density of public transport stops is a key proxy for urban accessibility and may be an indicator of the cities that have the largest transportation system in the world. So, which cities ensure the most comprehensive coverage of stops relative to population?
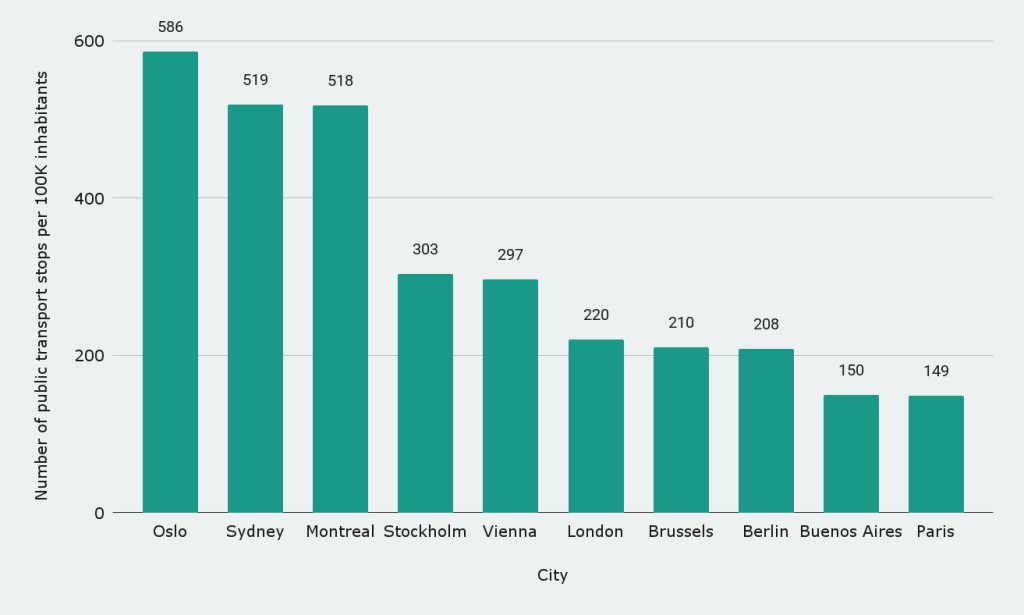
When cities with great public transportation have lots of public transport stops, like Oslo, Sydney, or Montreal, it usually means less walking, more options, and easier access, no matter where you’re staying. That’s great news if you're hopping between landmarks, catching free tours, or simply want to explore without relying on taxis or expensive rideshares.
On the other hand, cities with fewer stops might leave you walking longer distances or piecing together connections. That can add unexpected delays and drain energy, especially if you're trying to fit a lot into one day.
So before you book your accommodation or map out your sightseeing, check how close you are to key bus or train stops. A well-connected area can make your trip smoother, safer, and much more efficient.
To what extent does the scale of transport infrastructure align with urban needs? Comparing cities by route length sheds light on the spatial reach of their networks and helps to answer who has the largest transportation system in the world.
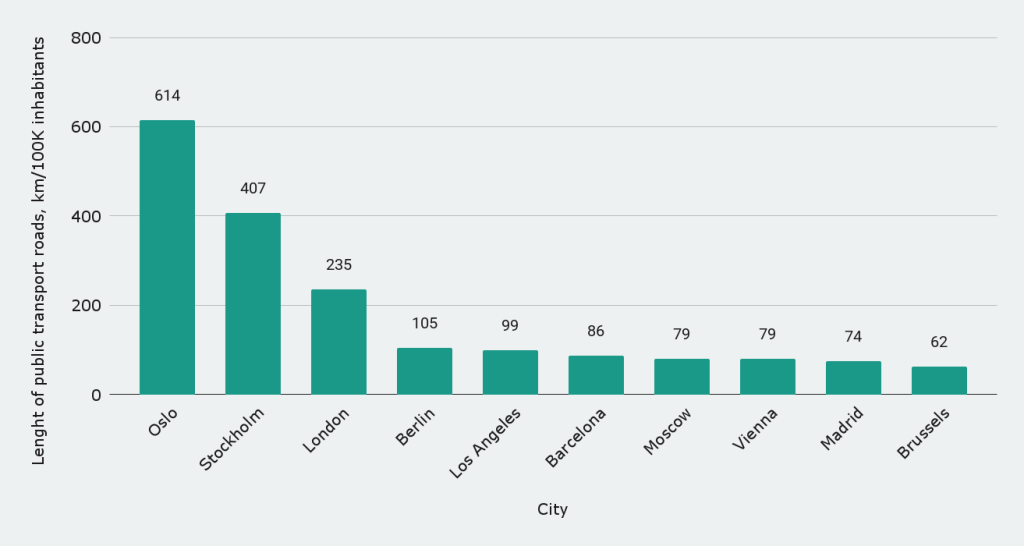
Cities like Oslo and Stockholm stand out for having a lot of public transport route coverage relative to their population, meaning you’re more likely to find reliable options no matter where you are. Whether you're staying in the center or exploring outer neighborhoods, this kind of network helps reduce transfers, saves time, and keeps your travel plans flexible.
In contrast, cities with shorter public transport road lengths per capita often rely on fewer core routes. This can mean more crowding, longer trips, or fewer direct connections — not ideal when you're on a tight sightseeing schedule.
If you're planning to use public transport during your visit, look for cities with broad route coverage. It’s a strong sign that you’ll have more freedom to explore — safely, affordably, and without needing to constantly check for rideshare availability.
Even with extensive infrastructure and wide accessibility, the affordability of public transportation can significantly influence how often people choose to use it.
Affordability is a crucial factor in transport equity. How much does a single public transport ride cost across different cities, and what does this say about accessibility for lower-income populations?
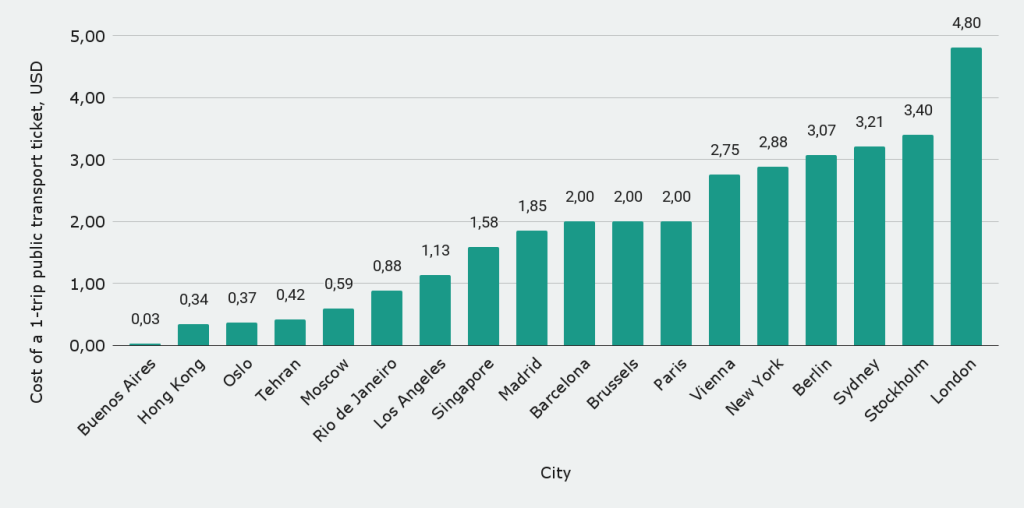
There is a stark global disparity in single-ticket transit pricing, influenced by factors such as public subsidies, operational costs, and urban policy priorities. Ultra-low fares in cities like Buenos Aires and Tehran may enhance accessibility but raise questions about financial sustainability. In contrast, high fares in cities like London and Stockholm might reflect advanced infrastructure or operating costs, but they could also pose equity challenges. Pricing strategies directly shape ridership behavior, modal shift potential, and inclusivity of public transport systems.
Public transport statistics by city
A multidimensional comparison is essential to fully understand the quality of urban transit. How do cities perform when evaluated across a set of infrastructure, accessibility, and pricing indicators?Oslo leads in infrastructure availability, with 586 stops and 614 km of public transport routes per 100K residents, despite a mid-range index score of 0.44.
Affordable fares don’t always mean great public transport, and higher prices don’t always guarantee the best experience. Cities like London and Berlin still rank among the top, even with pricier tickets, thanks to their efficient, well-connected systems that save you time and reduce the need for taxis or rideshares.
On the flip side, places like Buenos Aires and Tehran offer ultra-cheap transit, but the trade-off may be less coverage or outdated infrastructure, something to consider if you're planning to rely on buses or trains to get around.
If you're traveling on a budget, cities like Hong Kong and Singapore offer the best of both worlds: low-cost fares paired with clean, reliable, and easy-to-navigate networks. These insights can help you choose destinations, or neighborhoods within cities, where public transport can help you stretch your budget, stay safe, and make the most of your time exploring.
While ticket prices determine individual access, the overall quality and scale of a city’s public transport system reflect broader planning, investment, and user experience.
Comparing the public transport systems of top global cities helps travelers spot where they can move around easily, affordably, and safely, without needing to rely on expensive taxis or rentals. Whether you're hopping between free walking tours, museums, or neighborhoods off the beaten path, knowing how cities balance cost, coverage, and convenience makes a big difference.
We’ve also noted which cities offer Uber or similar ride-hailing apps, handy for late-night returns or areas less served by trains or buses. These insights let you plan smarter, save money, and enjoy your travels with less stress and more freedom.
Barcelona has a dense, accessible network with strong metro coverage.
Berlin’s system is one of the most efficient and accessible in Europe.
Brussels balances moderate coverage with strong public usage.
Buenos Aires has a basic but heavily used transport system.
Hong Kong offers world-class efficiency and coverage.
London’s network is massive and highly used but with low punctuality.
Los Angeles has limited public transport coverage and low ridership.
Madrid delivers reliable service with a strong metro system.
Montreal’s system is compact and moderately efficient.
New York offers massive coverage but variable infrastructure quality.
Oslo features one of the densest and most punctual systems in Europe.
Paris combines high ridership with strong multimodal connectivity.
Rio’s system covers key areas, but with modest ridership and routes.
Singapore is known for affordability, cleanliness, and high efficiency.
Stockholm offers strong metro access and top punctuality.
Sydney has an efficient network with good accessibility.
Tehran’s low-cost system is basic, with limited accessibility data.
Vienna consistently ranks high for access, reliability, and punctuality.
To assess and compare public transportation systems across global cities, composite index scores were developed based on standardized transportation performance metrics.
For the Public Transport Country Index, six key indicators were selected: annual public transport ridership per inhabitant, vehicle-kilometres in operation per inhabitant, number of public transport stops per 100,000 inhabitants, fleet size per 1 million inhabitants, accessibility for people with reduced mobility (in %), and the cost of a one-trip ticket (USD). Each variable was normalized using min-max scaling to a 0-1 range, with lower cost being considered more favorable. The normalized scores were then averaged to generate an overall city index, representing general efficiency, availability, and affordability of public transport.
For the Public Transport City Index, nine indicators were included to better reflect qualitative aspects of urban transit systems: annual ridership, vehicle-kilometres per capita, fleet size, average daily ridership, schedule compliance (%), accessibility (%), step-free access to metro stations (%), availability of a public transport app, and Wi-Fi in metro systems. Non-numeric attributes (such as app or Wi-Fi availability) were assigned binary values (1 = available, 0 = not available). All values were normalized and averaged to generate a composite quality score.
For the Rail Transit Accessibility Index, four indicators were used to capture key dimensions of how accessible and user-friendly a city's rail network is for the general public, including those with mobility challenges. These indicators are: the total number of metro routes, the percentage of accessibility for people with reduced mobility, the percentage of step-free access at metro stations, and schedule compliance (punctuality rate). Each metric was normalized to ensure comparability across cities. The final index value was calculated as a composite average of the normalized scores, providing a single figure that reflects the overall accessibility and operational reliability of the urban rail system.
Other ranking indicators, such as Rail Transit Accessibility, Number of Stops per Capita, Total Route Length, and Ticket Cost, were presented independently. For comparability, cities were ranked in descending order for all metrics, where a higher value indicated better infrastructure or service. In contrast, for cost-related indicators, ranks were assigned in ascending order, assuming lower cost reflects greater accessibility.
One-trip ticket prices, originally reported in local currencies, were converted into U.S. dollars using exchange rates from Forbes Currency Converter (https://www.forbes.com/advisor/money-transfer/currency-converter/) to ensure consistent cost comparisons across all cities.
In cases of missing data, normalization and ranking were performed using available values only, ensuring that the absence of specific inputs did not artificially deflate or inflate index scores.
Fact-checked
Last reviewed: July 9, 2025
Last updated: July 9, 2025
Licensed under CC BY 4.0
In this guide, we break down how public transport systems compare across major global cities and try to find cities with the best public transportation. From single-ticket prices to network reach and punctuality, you’ll find the insights you need to travel smarter, safer, and more affordably.
Key findings:
- London has the best public transportation system in the world in 2025, with a Public Transport City Index of 0.71.
- Oslo offers the world’s largest network by density, with 586 stops and 614 km of routes per 100,000 residents, making it a city that has the largest transportation system in the world.
- Hong Kong has the best rail transport system in the world in 2025, with a Rail Transit Accessibility Index of 0.78.
- Despite a high fare of $4.80, London proves that quality and reach can outweigh affordability in cities with the best public transportation rankings.
Countries with the best public transportation
How do countries compare in terms of overall public transport performance, and which national systems stand out in terms of accessibility, infrastructure, and affordability?
To assess the overall development of public transport systems across countries, we developed the Public Transport Country Index, a composite score based on six key indicators, including ridership, service volume, stop density, fleet size, accessibility, and ticket cost.
Top 10 countries with the best public transportation

- The United Kingdom leads the ranking with the highest Public Transport Country Index of 0.82, significantly ahead of other nations.
- Sweden and Australia follow in second and third place with scores of 0.63 and 0.61, respectively.
- Highly urbanized countries like China (0.49) and Russia (0.47) lag behind the top performers in overall public transport quality.
Looking at the bigger picture, the United Kingdom stands out for having one of the most reliable and extensive public transport systems that every budget-conscious traveler can appreciate. Thanks to long-term investments and well-connected networks, getting around cities like London is efficient (even if not always cheap).
Countries like Sweden, Australia, and Germany also offer high-quality systems that combine good accessibility, regular service, and a generally smooth experience, perfect for travelers who want to explore without renting a car or worrying about navigation.
On the flip side, while places like China and Russia have massive transit networks, their quality can vary a lot by region. This means travelers should do some extra research before relying entirely on public transport in those countries.
Focus on cities with public transportation and infrastructure
Let’s explore how cities around the world perform across key dimensions of public transport systems, including accessibility, infrastructure density, and affordability.
By comparing urban transit indices, number of stops, rail coverage, and ticket prices, we can identify which cities offer the most effective and inclusive mobility for residents and deserve to be called cities with the best public transportation.
From London’s high-performing but expensive network to Oslo’s unmatched infrastructure scale, the data highlight diverse models of public transport success and where key challenges remain.
Cities with the best public transportation
Identifying the global leaders in urban public transport can offer benchmarks for other cities striving to enhance the quality and efficiency of their transit systems.
To better reflect the quality of urban transit services, we introduced the Public Transport City Index, which integrates nine indicators such as network scale, usage levels, accessibility, punctuality, and availability of digital features like apps and Wi-Fi.

- London leads the ranking with a Public Transport City Index of 0.71, setting the benchmark for urban mobility as a city with great public transportation.
- Hong Kong (0.67) and Berlin (0.66) closely follow, reflecting high ridership, system efficiency, and accessibility.
- Buenos Aires ranks 7th with an index of 0.54, outperforming several European cities despite regional infrastructure challenges.
What do London, Hong Kong, and Berlin have in common? For travelers, they offer some of the world’s smoothest, most connected transport systems, making it easy to hop between neighborhoods, landmarks, or even airports without stress. These global hubs are a dream for those who want to see a lot in a short time, using just one transport card or app. These cities are really cities with the best public transportation.
But top-quality public transport isn’t just found in the world’s richest cities. Places like Buenos Aires and Moscow show that you can get excellent, affordable transit even in budget-friendly destinations. And cities like Vienna or Brussels, though less flashy, are proof that steady investment pays off in reliability and comfort for visitors and locals alike.
Cities with the worst public transportation
While some cities have the best public transportation, others face critical challenges in delivering accessible and effective public transportation. What do the lowest-ranked cities reveal about these shortcomings?

- Tehran ranks lowest with a Public Transport City Index of 0.14, reflecting major limitations in accessibility, service quality, and network coverage.
- Montreal (0.17) and Los Angeles (0.27) highlight significant public transport underperformance in high-income countries.
- Singapore and Oslo, despite strong infrastructure in other mobility metrics, rank lower (0.41 and 0.44, respectively), indicating gaps in user experience or service reach.
It’s easy to assume that rich cities always have great transport, but that’s not always the case. Even cities with great public transportation, like New York, Los Angeles, and Montreal, can leave travelers stuck in traffic, waiting on platforms, or juggling confusing fare systems. So, don’t let a city’s fame (or GDP) fool you.
On the other hand, places like Tehran and Rio de Janeiro reveal how deeper infrastructure or funding issues can impact your daily movement as a visitor, especially if you rely on public transport to explore.
And what about cities you’d expect to score near the top, like Paris, Singapore, or Oslo? While their systems are often modern and clean, travelers might still face surprises when it comes to pricing, accessibility, or transfers.
Beyond infrastructure size and investment, accessibility determines how effectively urban transport systems serve the daily needs of citizens.
Focus on cities by public transport accessibility
To capture how accessible and user-friendly metro systems are for all users, including those with mobility challenges, we constructed the Rail Transit Accessibility Index, combining data on route numbers, step-free access, general accessibility, and service punctuality. By analyzing the Rail Transit Accessibility Index and comparing it with network reach and stop density, we highlight which urban environments provide the most convenient and equitable access to transport.
Accessibility is a key indicator of inclusivity for cities with great public transportation. Cities that perform well in this area ensure that mobility is not just available, but truly usable, for all segments of the population.
Cities with the best rail transit accessibility
Rail systems are central to many cities’ mobility strategies. So, which urban areas provide the most accessible and connected rail infrastructure to their residents?

- Hong Kong leads globally with a Rail Transit Accessibility Index of 0.78, reflecting its dense, efficient metro coverage as one of the cities with the best public transportation.
- Sydney (0.69) and Madrid (0.67) also perform strongly, demonstrating robust regional rail and urban metro integration.
- Rio de Janeiro and Oslo make the top 10 with indexes of 0.58 and 0.55, despite not being commonly associated with world-class transit.
If you’re visiting a city like Hong Kong or Sydney, the good news is that getting around by train is surprisingly easy. Thanks to smart planning and modern infrastructure, you won’t need to rely on taxis or long walks to reach a station.
It’s not just the usual suspects either. Cities like Rio and Oslo show that top-notch rail accessibility isn’t limited to Europe or Asia’s megacities. For travelers, that means more places where you can hop on a train just minutes from your hostel, a free walking tour meeting point, or a favorite café.
Why does this matter? Because the easier it is to access the rail system, the more time and money you’ll save, and the less you’ll need to worry about navigating traffic or figuring out transfers. This is what you get when travelling to cities with great public transportation. Whether you’re squeezing in landmarks between walking tours or catching a sunset from the other side of town, strong rail access can make your day smoother, cheaper, and more relaxed.
Cities with the worst rail transit accessibility
A lack of rail transit accessibility may hinder mobility and sustainability. So, which cities are falling behind the cities with the best public transportation, and why?

- Tehran ranks lowest with a Rail Transit Accessibility Index of just 0.10, indicating minimal spatial coverage or access for residents.
- Brussels (0.13) and Montreal (0.20) highlight surprising infrastructure gaps in otherwise developed urban regions.
- Singapore and New York both score 0.50, underperforming relative to their global reputations for efficient transit.
In cities like Tehran, Brussels, and Montreal, getting to a train might take longer than you’d expect, especially if you're staying outside the city center. Even in famous cities like Singapore and New York, you might find yourself walking further or relying on buses or taxis just to reach a rail station.
For travelers, that means planning is key. Low rail accessibility can eat into your time and budget, especially if you're trying to make the most of a short trip or jump between free walking tours across town.
But don't let that stop you. Most of these cities still offer solid transit once you're plugged into the network. Just keep in mind that choosing accommodation closer to a major rail or metro hub can save you both time and stress, and make your days more flexible and spontaneous.
While accessibility reflects how well public transport serves users, the scale and spread of physical infrastructure also shape everyday mobility.
Focus on cities by public transport stops and roads
Let's examine the physical density and coverage of public transportation networks by analyzing the number of stops per 100K inhabitants and the total length of public transport routes.
These indicators reveal how thoroughly a city’s transit system is woven into its urban fabric, affecting walkability, waiting times, and overall convenience for riders.
Cities with extensive and well-distributed networks tend to reduce reliance on private vehicles and promote sustainable mobility for the broader population.
Cities with the biggest number of public transport stops
The density of public transport stops is a key proxy for urban accessibility and may be an indicator of the cities that have the largest transportation system in the world. So, which cities ensure the most comprehensive coverage of stops relative to population?

- Oslo leads with 586 public transport stops per 100K inhabitants, suggesting exceptional network density and last-mile coverage.
- Sydney (519) and Montreal (518) also demonstrate highly distributed public transport infrastructure.
- Paris and Buenos Aires fall below 150 stops, indicating more centralized or less granular coverage.
When cities with great public transportation have lots of public transport stops, like Oslo, Sydney, or Montreal, it usually means less walking, more options, and easier access, no matter where you’re staying. That’s great news if you're hopping between landmarks, catching free tours, or simply want to explore without relying on taxis or expensive rideshares.
On the other hand, cities with fewer stops might leave you walking longer distances or piecing together connections. That can add unexpected delays and drain energy, especially if you're trying to fit a lot into one day.
So before you book your accommodation or map out your sightseeing, check how close you are to key bus or train stops. A well-connected area can make your trip smoother, safer, and much more efficient.
Cities by total length of public transport roads
To what extent does the scale of transport infrastructure align with urban needs? Comparing cities by route length sheds light on the spatial reach of their networks and helps to answer who has the largest transportation system in the world.

- Oslo ranks first with 614 km of public transport roads per 100K inhabitants, more than 50% longer than second-ranked Stockholm (407 km).
- London holds a strong third with 235 km, nearly double that of Berlin (105 km).
- Lower-end cities like Brussels (62 km) and Madrid (74 km) may face constraints in network capacity and reach.
Top 10 cities by total length of public transport roads
Cities like Oslo and Stockholm stand out for having a lot of public transport route coverage relative to their population, meaning you’re more likely to find reliable options no matter where you are. Whether you're staying in the center or exploring outer neighborhoods, this kind of network helps reduce transfers, saves time, and keeps your travel plans flexible.
In contrast, cities with shorter public transport road lengths per capita often rely on fewer core routes. This can mean more crowding, longer trips, or fewer direct connections — not ideal when you're on a tight sightseeing schedule.
If you're planning to use public transport during your visit, look for cities with broad route coverage. It’s a strong sign that you’ll have more freedom to explore — safely, affordably, and without needing to constantly check for rideshare availability.
Even with extensive infrastructure and wide accessibility, the affordability of public transportation can significantly influence how often people choose to use it.
Cost of a 1-trip public transport ticket by city
Affordability is a crucial factor in transport equity. How much does a single public transport ride cost across different cities, and what does this say about accessibility for lower-income populations?

- Buenos Aires has the lowest fare at just $0.03, making it nearly 160 times cheaper than London, which tops the list at $4.80.
- Most Western European cities like Brussels, Paris, and Barcelona cluster around the $2.00 mark, indicating a typical mid-range fare zone.
- Several Asian cities like Hong Kong ($0.34) and Tehran ($0.42) offer exceptionally low prices, suggesting stronger subsidies or different fare policy models.
There is a stark global disparity in single-ticket transit pricing, influenced by factors such as public subsidies, operational costs, and urban policy priorities. Ultra-low fares in cities like Buenos Aires and Tehran may enhance accessibility but raise questions about financial sustainability. In contrast, high fares in cities like London and Stockholm might reflect advanced infrastructure or operating costs, but they could also pose equity challenges. Pricing strategies directly shape ridership behavior, modal shift potential, and inclusivity of public transport systems.
Public transport statistics by city
A multidimensional comparison is essential to fully understand the quality of urban transit. How do cities perform when evaluated across a set of infrastructure, accessibility, and pricing indicators?Oslo leads in infrastructure availability, with 586 stops and 614 km of public transport routes per 100K residents, despite a mid-range index score of 0.44.
- London tops the Public Transport Index (0.71) but has the highest fare at $4.80, contrasting with cities like Hong Kong, which balances a high index (0.67) with a low fare of $0.34.
- Stockholm and Sydney rank high in rail accessibility (≥0.67) and public transport stop density (>300 stops), though their ticket prices are on the higher end ($3.21-$3.40).
Affordable fares don’t always mean great public transport, and higher prices don’t always guarantee the best experience. Cities like London and Berlin still rank among the top, even with pricier tickets, thanks to their efficient, well-connected systems that save you time and reduce the need for taxis or rideshares.
On the flip side, places like Buenos Aires and Tehran offer ultra-cheap transit, but the trade-off may be less coverage or outdated infrastructure, something to consider if you're planning to rely on buses or trains to get around.
If you're traveling on a budget, cities like Hong Kong and Singapore offer the best of both worlds: low-cost fares paired with clean, reliable, and easy-to-navigate networks. These insights can help you choose destinations, or neighborhoods within cities, where public transport can help you stretch your budget, stay safe, and make the most of your time exploring.
While ticket prices determine individual access, the overall quality and scale of a city’s public transport system reflect broader planning, investment, and user experience.
Overview of the biggest cities’ public transport systems
Comparing the public transport systems of top global cities helps travelers spot where they can move around easily, affordably, and safely, without needing to rely on expensive taxis or rentals. Whether you're hopping between free walking tours, museums, or neighborhoods off the beaten path, knowing how cities balance cost, coverage, and convenience makes a big difference.
We’ve also noted which cities offer Uber or similar ride-hailing apps, handy for late-night returns or areas less served by trains or buses. These insights let you plan smarter, save money, and enjoy your travels with less stress and more freedom.
Public transportation in Barcelona
Barcelona has a dense, accessible network with strong metro coverage.
- 87 stops/100K inhabitants, 133.94 rides/year/inhabitant.
- Ticket price 2 USD/trip, 9 metro routes.
- Accessibility 100%, step-free stations 92%.
- Is there Uber in Barcelona? Yes.
Public transportation in Berlin
Berlin’s system is one of the most efficient and accessible in Europe.
- 208 stops/100K inhabitants, 437.77 rides/year/inhabitant.
- Ticket price 3.07 USD/trip, 10 metro lines.
- Accessibility 100%, step-free access 89.9%.
- Is there Uber in Berlin? Yes.
Public transportation in Brussels
Brussels balances moderate coverage with strong public usage.
- 210 stops/100K inhabitants, 371.43 rides/year/inhabitant.
- Ticket price 2 USD/trip, 3 metro routes.
- Accessibility 69.7%.
- Is there Uber in Brussels? Yes.
Public transportation in Buenos Aires
Buenos Aires has a basic but heavily used transport system.
- 150 stops/100K inhabitants, 84.01 rides/year/inhabitant, 13,6M daily journeys.
- Ticket price 0.03 USD/trip, 6 metro lines.
- Punctuality 88.19%.
- Is there Uber in Buenos Aires? Yes.
Public transportation in Hong Kong
Hong Kong offers world-class efficiency and coverage.
- 327.87 rides/year/inhabitant, 8,5M daily journeys.
- Ticket price 0.34 USD/trip, 23 metro routes.
- Accessibility 95%, punctuality 96.8%.
- Is there Uber in Hong Kong? Yes.
Public transportation in London
London’s network is massive and highly used but with low punctuality.
- 562.51 rides/year/inhabitant, 13,7M daily trips.
- Ticket price 4.8 USD/trip, 11 metro lines.
- Accessibility 100%, punctuality 30%.
- Is there Uber in London? Yes.
Public transportation in Los Angeles
Los Angeles has limited public transport coverage and low ridership.
- 124 stops/100K inhabitants, 32.77 rides/year/inhabitant.
- Ticket price 1.13 USD/trip, 2 metro routes.
- Accessibility 100%.
- Is there Uber in Los Angeles? Yes.
Public transportation in Madrid
Madrid delivers reliable service with a strong metro system.
- 241.87 rides/year/inhabitant, 5,2M daily journeys.
- Ticket price 1.85 USD/trip, 12 metro lines.
- Accessibility 100%, punctuality 65%.
- Is there Uber in Madrid? Yes.
Public transportation in Montreal
Montreal’s system is compact and moderately efficient.
- 518 stops/100K inhabitants; 48.16 rides/year/inhabitant.
- 4 metro lines.
- Accessibility 67%, punctuality 26%.
- Is there Uber in Montreal? Yes.
Public transportation in New York
New York offers massive coverage but variable infrastructure quality.
- 445.83 rides/year/inhabitant.
- Ticket price 2.88 USD/trip, 5 metro lines.
- 28% step-free metro access.
- Is there Uber in New York? Yes.
Public transportation in Oslo
Oslo features one of the densest and most punctual systems in Europe.
- 586 stops/100K inhabitants, 183.77 rides/year/inhabitant.
- Ticket price 0.37 USD/trip, 5 metro lines.
- Accessibility 72%, punctuality 99%.
- Is there Uber in Oslo? Yes.
Public transportation in Paris
Paris combines high ridership with strong multimodal connectivity.
- 381.17 rides/year/inhabitant, 11,3M daily journeys.
- Ticket price 2 USD/trip, 8 metro lines.
- Accessibility 100%, punctuality 10.6%.
- Is there Uber in Paris? Yes.
Public transportation in Rio de Janeiro
Rio’s system covers key areas, but with modest ridership and routes.
- 116.64 rides/year/inhabitant.
- Ticket price 0.88 USD/trip, 3 metro lines, 100% step-free access.
- Is there Uber in Rio de Janeiro? Yes.
Public transportation in Singapore
Singapore is known for affordability, cleanliness, and high efficiency.
- 342.43 rides/year/inhabitant.
- Ticket price 1.58 USD/trip, 4 metro lines.
- Accessibility 63%, punctuality 100%.
- Is there Uber in Singapore? No.
Public transportation in Stockholm
Stockholm offers strong metro access and top punctuality.
- 239.56 rides/year/inhabitant.
- Ticket price 3.4 USD/trip, 7 metro lines.
- Accessibility 100%, punctuality 100%.
- Is there Uber in Stockholm? Yes.
Public transportation in Sydney
Sydney has an efficient network with good accessibility.
- 77.41 rides/year/inhabitant.
- Ticket price 3.21 USD/trip, 9 metro lines.
- Accessibility 97%, punctuality 100%
- Is there Uber in Sydney? Yes.
Public transportation in Tehran
Tehran’s low-cost system is basic, with limited accessibility data.
- 50.12 rides/year/inhabitant.
- Ticket price 0.42 USD/trip, 6 metro lines.
- Punctuality 12.6%.
- Is there Uber in Tehran? No.
Public transportation in Vienna
Vienna consistently ranks high for access, reliability, and punctuality.
- 345.11 rides/year/inhabitant.
- Ticket price 2.75 USD/trip, 5 metro routes, 100% step-free access.
- Accessibility 86%, punctuality 100%.
- Is there Uber in Vienna? Yes.
Conclusions
- A big network doesn’t always mean smooth travel. Take Oslo, for example, it boasts over 586 stops and 600 km of transit routes per 100,000 people, yet its overall transport performance remains moderate. For tourists, this means that more buses or stations don’t automatically make getting around easier. What matters is how frequent, reliable, and well-connected the system is, especially when you're trying to stick to a tight itinerary or hop between free tours.
- Expensive doesn’t always mean bad, and cheap doesn’t always mean good when we are talking about cities with the best public transportation. London has the highest single-ticket price ($4.80), yet tops our ranking for overall system performance. Why? Because it offers excellent service, wide coverage, and dependable travel times. If you're visiting for a few days, investing in a transit pass or paying a bit more per ride may save you stress, time, and Uber fees.
- Meanwhile, cities like Buenos Aires offer ultra-low fares (just $0.03), but limited network reach and infrastructure may make your journey longer or less predictable. So, while budget-friendly options are great, make sure the system gets you where you need to go, reliably.
- Accessibility isn’t everything either. Stockholm and Sydney rank high in stop density and rail access, but daily ridership stays relatively low. That means even in cities with great infrastructure, public transport may not always be the fastest or most popular way to get around. Tourists should factor in local habits, walkability, and alternatives like bike shares or ride-hailing apps.
Methodology
To assess and compare public transportation systems across global cities, composite index scores were developed based on standardized transportation performance metrics.
For the Public Transport Country Index, six key indicators were selected: annual public transport ridership per inhabitant, vehicle-kilometres in operation per inhabitant, number of public transport stops per 100,000 inhabitants, fleet size per 1 million inhabitants, accessibility for people with reduced mobility (in %), and the cost of a one-trip ticket (USD). Each variable was normalized using min-max scaling to a 0-1 range, with lower cost being considered more favorable. The normalized scores were then averaged to generate an overall city index, representing general efficiency, availability, and affordability of public transport.
For the Public Transport City Index, nine indicators were included to better reflect qualitative aspects of urban transit systems: annual ridership, vehicle-kilometres per capita, fleet size, average daily ridership, schedule compliance (%), accessibility (%), step-free access to metro stations (%), availability of a public transport app, and Wi-Fi in metro systems. Non-numeric attributes (such as app or Wi-Fi availability) were assigned binary values (1 = available, 0 = not available). All values were normalized and averaged to generate a composite quality score.
For the Rail Transit Accessibility Index, four indicators were used to capture key dimensions of how accessible and user-friendly a city's rail network is for the general public, including those with mobility challenges. These indicators are: the total number of metro routes, the percentage of accessibility for people with reduced mobility, the percentage of step-free access at metro stations, and schedule compliance (punctuality rate). Each metric was normalized to ensure comparability across cities. The final index value was calculated as a composite average of the normalized scores, providing a single figure that reflects the overall accessibility and operational reliability of the urban rail system.
Other ranking indicators, such as Rail Transit Accessibility, Number of Stops per Capita, Total Route Length, and Ticket Cost, were presented independently. For comparability, cities were ranked in descending order for all metrics, where a higher value indicated better infrastructure or service. In contrast, for cost-related indicators, ranks were assigned in ascending order, assuming lower cost reflects greater accessibility.
One-trip ticket prices, originally reported in local currencies, were converted into U.S. dollars using exchange rates from Forbes Currency Converter (https://www.forbes.com/advisor/money-transfer/currency-converter/) to ensure consistent cost comparisons across all cities.
In cases of missing data, normalization and ranking were performed using available values only, ensuring that the absence of specific inputs did not artificially deflate or inflate index scores.
Sources
- “A Global Analysis of Transit Data.” CityTransit Data, https://citytransit.uitp.org. Accessed 6 Aug. 2025.
- Guagenti, Calogero. “Currency Conversion Calculator | Currency Converter - Forbes Advisor.” Forbes Advisor, 8 June 2025, https://www.forbes.com/advisor/money-transfer/currency-converter/.
- “Uber Cities - Rides Around the World | Uber.” Uber, https://www.uber.com/us/en/r/cities/. Accessed 6 Aug. 2025.
Fact-checked
Last reviewed: July 9, 2025
Last updated: July 9, 2025
Licensed under CC BY 4.0